For many years, LRS has provided print accounting and auditing that enables organizations to better manage costs while improving security and compliance with data usage rules. However, based on trends in the IT industry and customer feedback, we felt it was time to make some major enhancements to our Innovate/Audit reporting capability. These enhancements are now generally available to LRS customers.
With the new reporting function, we replaced a flat record structure database with a data warehouse model and leveraged SQL Server Analysis Services, which is an online analytical processing and data mining tool in Microsoft SQL Server.
SQL Server Analysis Services can create a special data structure called an online analytical processing (OLAP) “cube.” According to Microsoft, “An OLAP cube is a data structure that overcomes the limitations of relational databases by providing rapid analysis of data. Cubes can display and sum large amounts of data while also providing users with searchable access to any data points. This way, the data can be rolled up, sliced, and diced as needed to handle the widest variety of questions that are relevant to a user’s area of interest.”
In short, think of a cube as a multidimensional array of data that is optimized for data warehouse and online analytical processing applications. It dramatically improves query times for reporting purposes, which is exactly what LRS and our customers want. How significant is the performance improvement over the previous Innovate/Audit reporting capability? Our internal testing shows a 50-100x response time improvement when generating reports using very large databases!
Next, we developed a new set of standard reports in SQL Server Reporting Services based on a cube that we defined. For example, we now have departmental and location-based reports to facilitate cost center analysis that can dynamically retrieve information from Active Directory. To safeguard sensitive personal and business information, organizations can redact or substitute information in the reports, such as user name and document name.
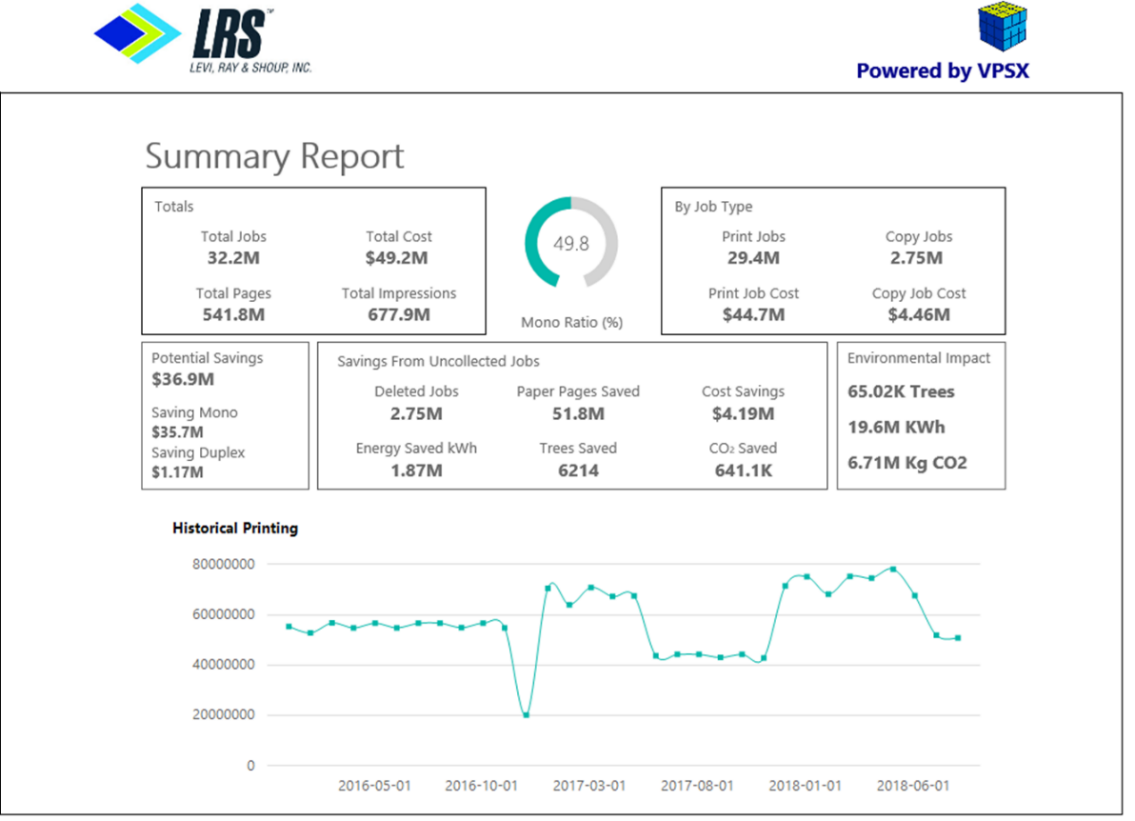
We also created a new summary report that provides a one-stop dashboard for key operational metrics, including various cost, saving, and environmental impact values. We used the findings from a study done by a European university to calculate the estimated number of trees, kilowatt usage, and CO2 values, but customers can modify the underlying metrics to use values that they think are more accurate. Here is a sample summary report for a fictional business:
Perhaps the most significant reports are the ones that customers can quickly and easily create on their own using simple tools and applications that they already have; for example, Microsoft Excel with its Power Pivot feature. An OLAP cube allows business users to analyze Innovate/Audit data in a variety of ways, providing more capabilities and customizations than LRS can deliver with a set of standard reports.
In summary, the ability for customers to import and use an OLAP cube data structure is powerful. Think of the number of custom reports and dashboards that you can generate to address your unique operational and business requirements, including those optimized for viewing on mobile devices. Click on the following graphic to see an example:
Like Burger King, we want you and other customers to “have it your way.” You know best what data is meaningful to your organizations, and you can easily view and analyze the data however you want to achieve whatever business objective is required.
With this new Innovate/Audit reporting update, we are adding “analytics” to our accounting and auditing value proposition. Contact LRS to learn more about this new capability. We have a great story to share with you.